


ChurchTools comes standard with several typical ad hoc reports that provide answers to questions about congregational development and ChurchTools usage. The reports are always run immediately and therefore reflect the current state of affairs.
Statistics
Ad Hoc reports are statistical data. This means that a basic understanding of how to interpret statistics is necessary to understand the reports.
Run an Ad Hoc Report #
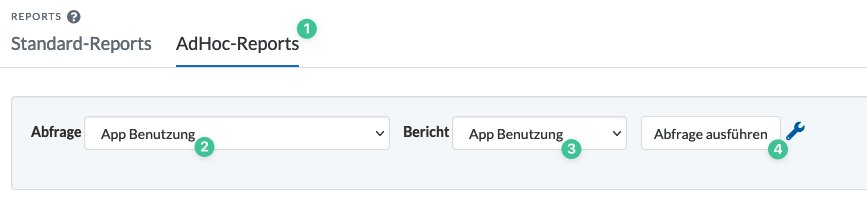
Under Ad Hoc Reports (1), select the desired query (2) and specify the desired report (3) if there are multiple options. If report filters exist for the selected query, they will be displayed on a second line.
Once you’ve selected everything, click “Run Query” (4) to start, and you’ll see the result.
Statistics Settings #
The query results are displayed in the center. By default, the chart type specified in the master data for the ad hoc report is used (see [[How do I create a new ad hoc report?]]).
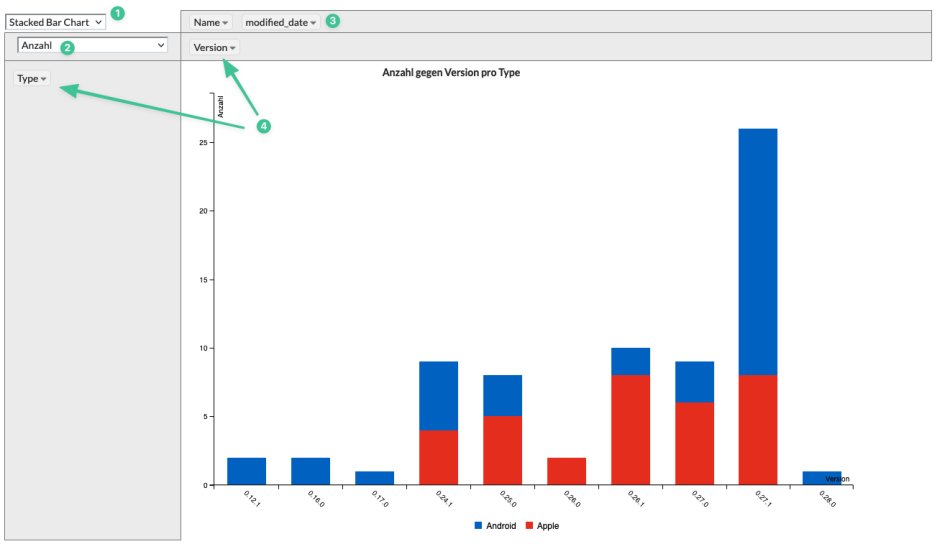
(1) You can change the chart type at any time.
(2) The same applies to the aggregation of the data.
(3) This section displays the fields from the query that are not yet being used in the current report. If you want to use them, simply drag and drop them into the column or row (4).
(4) Fields in the query that are used as columns or rows in this view.
Multiple fields can be used for the column or row display. This groups the values.
For example, this allows you to compare reports not only by year but also by year/month.
Order of the Fields
Please note that the order of the fields in the column/row is important. For example, the display for “Year/Month” is different from that for “Month/Year.”